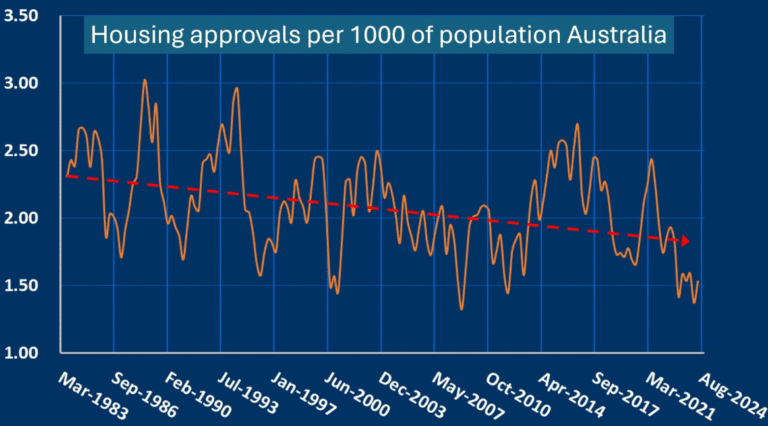
The continual decline in the supply of housing over the last 40 years was a big driver of house price increases. The graph shows quarterly approvals per 1000 persons. Approvals correlate very closely with actual construction.
House prices rose at an inflation-adjusted (real) rate of 3.2% per year in the 40 years to 1 Jan 2024. Houses in leafy suburbs grew at a faster rate, and apartments and regional housing at a slower rate (but they have higher yields).
Can that rate of growth be repeated over the next 25 years?
There are structural reasons (built into the economy) that point for a repeat and others that point against a repeat of the rapid house price increases of 1984-2024.
A crucial question is, will the supply of houses as a percentage of the population stay low or even continue to fall?
I hope it will rise, for the sake of the generation trying to buy homes, but I don’t think it will.
The main impediment to increased supply is the lack of political will. State and federal politicians refuse to expend the political capital needed to overcome bureaucratic inertia and local resistance to increased housing approvals.
I expect this graph to flatten out, but not to rise over time.
That is good news for residential property investors and bad news for homebuyers.
Copyright September 2024 Sam Wylie